

“You cannot control what you cannot measure”
This applies to the world of payment solutions which is getting increasingly complex and businesses need effective ways to measure effectiveness, efficacy and efficiency.
This is highly critical for an organization as cash flows have a direct impact on the bottomline. A high degree of accountability that is assumed to be a given when it comes to payments.
When customers on your platform click ‘Pay Now’, it signifies more than a transaction – it reflects trust, intent, and the potential for lifetime value. Yet, in the world of digital payment solutions, payment failures and inefficiencies silently erode revenue and inflate operational costs, often without clear financial visibility.
For digital platforms, especially in e-commerce, tracking payment performance is essential for finance teams to quantify leakage, control costs, and optimize profitability. Here are the 7 payment metrics that every finance leader should monitor, report, and act upon.
1. Payment Success Rate (%)
This metric measures the percentage of payment attempts that result in successful transactions. A high success rate directly correlates with higher realized revenue and a better customer experience.
- Formula:
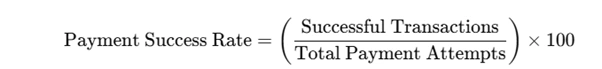
For example, if your platform records 10,000 payment attempts and 9,200 are successful, your success rate is 92%. With an average order value (AOV) of ₹1,200, this translates to ₹1.10 crores in revenue. A drop to 85% success means losing ₹8.4 lakhs monthly.
- Track: Daily for real-time trends, weekly to compare by payment method and gateway.
- Decision Trigger: Investigate gateways, issuers, or payment methods contributing to dips; consider smart routing.
2. Payment Failure Rate (%)
The payment failure rate captures the proportion of payment attempts that fail. Each failure represents lost sales, abandoned carts, and higher support tickets.
- Formula:
![]()
If the failure rate is 8% on 10,000 payment attempts at ₹1,200 AOV, you’re losing ₹9.6 lakhs in potential revenue.
- Track: Daily and weekly to catch sudden spikes.
- Decision Trigger: Identify the cause – customer errors, bank downtimes, or gateway issues – and fix them proactively.
3. Acceptance Rate (%)
This measures the percentage of payment transactions that are successfully approved or authorized by issuers or PSPs out of the total number of attempts.
Acceptance Rate (%)=Total Transaction AttemptsNumber of Approved / Authorized Transactions×100
Example: If 9,000 transactions were authorized out of 10,000 attempted,
Acceptance Rate=(9,000/10,000)×100=90%
4. Revenue Lost to Payment Failures (₹)
This metric quantifies the total monetary value of failed payments that didn’t result in recovery.
- Formula:
![]()
For example, with an 8% failure rate on 10,000 transactions at ₹1,200 AOV, the revenue loss is ₹9.6 lakhs per month.
- Track: Monthly for cumulative impact.
- Decision Trigger: Use this insight to justify investments in better payment infrastructure or orchestration platforms.
5. Revenue Recovery Rate (%)
Not every failed payment is a lost cause. The recovery rate tracks what percentage of failed transactions were successfully retried and completed.
- Formula:

If 800 payments fail but 400 are recovered, the recovery rate is 50%, equating to ₹4.8 lakhs in salvaged revenue.
- Track: Weekly and monthly to monitor effectiveness of retry strategies.
- Decision Trigger: If recovery rates are low, introduce auto-retries, offer alternative payment methods, or improve failure communication.
6. Payment Gateway Cost per Transaction (₹ / %)
This metric helps finance teams measure the fees paid to payment gateways per successful transaction.
- Formula:
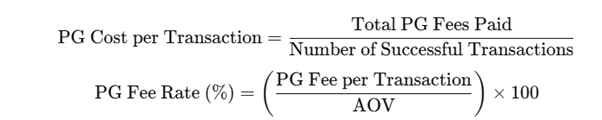
If the PG fee is ₹18 on a ₹1,200 transaction, that’s 1.5% per transaction. Across 9,200 transactions, this sums up to ₹1.65 lakhs in monthly PG fees.
- Track:
- Decision Trigger: If PG costs are too high relative to success rates, renegotiate fees or diversify gateway usage through smart routing.
7. Refund and Chargeback Rate (%)
This metric captures the percentage of transactions that are refunded or reversed due to chargebacks. High rates not only represent revenue leakage but also signal customer dissatisfaction or fraud.
- Formula:

If 180 out of 9,200 transactions are refunded, that’s a 1.95% refund/chargeback rate, amounting to ₹2.16 lakhs in lost revenue.
- Track: Weekly for B2C platforms, monthly for others.
- Decision Trigger: High rates should prompt a review of fraud controls, product quality, and customer support practices.
Bonus Metrics:
1. Cost per Payment Failure (₹)
Beyond lost revenue, each failed payment carries operational costs – support, reconciliation, and processing overheads.
- Formula:

If ₹40,000 is spent managing 800 failures, that’s ₹50 per failure.
- Track: Monthly to assess ops burden.
- Decision Trigger: If costs per failure rise, finance teams can build a case for automating support, streamlining reconciliation, or fixing core payment issues.
2. Time to Settlement (days/hours)
Time to Settlement is the duration between when a customer makes a payment and when the merchant actually receives the funds in their bank account.
This could vary depending upon the mode of payment. For UPI, it is near real-time, whereas for card payments, it could take T + (1-3) days.
Time to Settlement=Settlement Date−Transaction Date
- Track: Weekly to maintain consistency..
- Decision Trigger: Stay atop cash flow liquidity and aware of reconciliation complexity.
Reporting and Decision Framework
| Metric | Track Frequency | Key Finance Actions |
| Payment Success/Failure Rate/Acceptance Rate | Daily, Weekly | Monitor for trends, trigger gateway/bank optimizations |
| Revenue Lost to Failures | Monthly | Build ROI cases for infrastructure improvements |
| Revenue Recovery Rate | Weekly, Monthly | Improve retry strategies, introduce alternatives |
| PG Cost per Transaction | Monthly | Optimize payment mix, renegotiate fees |
| Refund/Chargeback Rate | Weekly | Strengthen fraud detection, improve product or service quality |
| Cost per Payment Failure | Monthly | Automate support, optimize ops costs |
Finance teams should integrate these metrics into their monthly performance reviews, ensuring alignment with product, operations, and growth teams. A payments health dashboard can centralize this visibility for real-time and strategic decision-making.
Conclusion
Payments are often treated as a technical backend, but in reality, they are the frontline of revenue capture. For finance teams, tracking these 7 metrics provides a strategic lever to recover lost revenue, control costs, and enhance customer experience.
Because in the world of digital platforms, every payment failure is not just a missed transaction—it’s a missed opportunity to grow.
Need help building a payments performance dashboard? Let’s connect.